in:Flux v5.4 Release Highlights
October 14, 2026 · Allen Miller
Summary
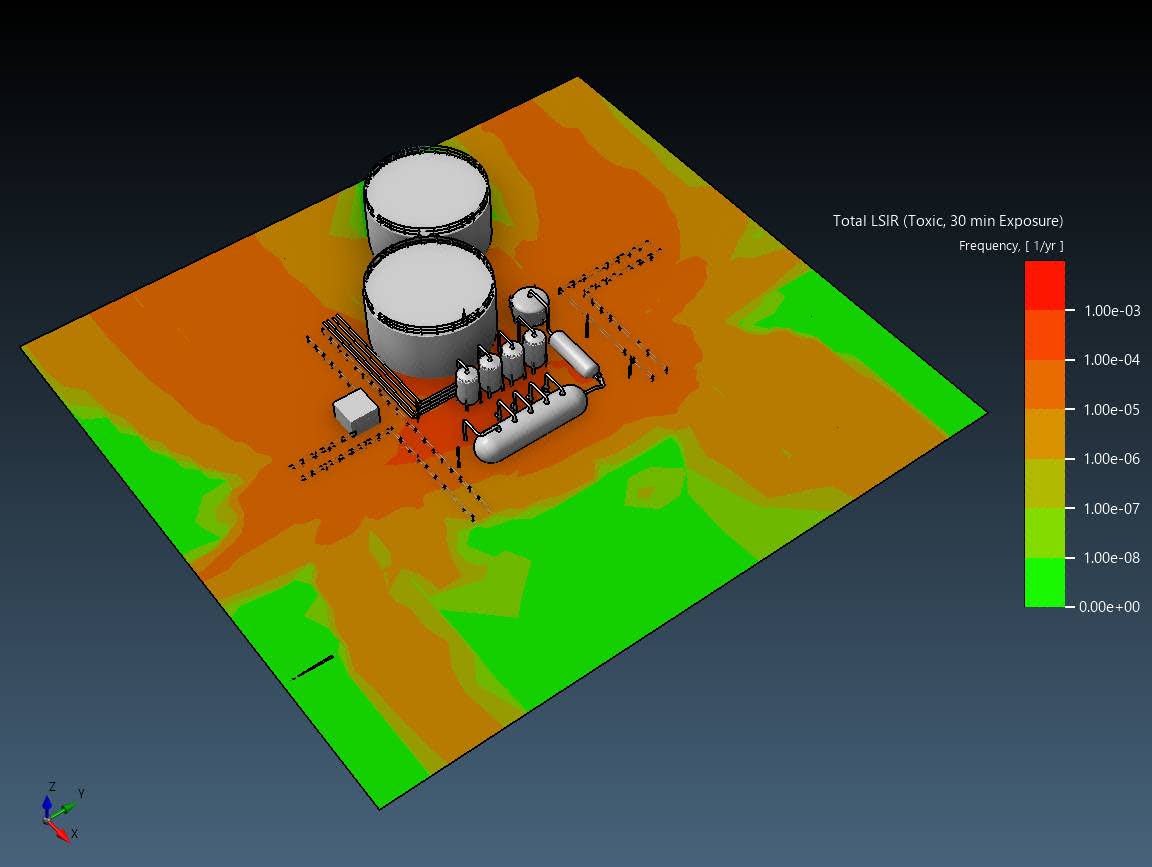
- We are pleased to include Quantitative Risk Assessment (QRA) capabilities as part of in:Flux. The QRA capabilities can be applied to toxic or thermal doses, and output individual and group (societal) risk based on probits. The new Occupied Region item enables populations to be added of various groups, and risk statistics such as LSIR, IRPA, PLL and FAR are generated, as well as F-N curves. Occupied regions can be set either as indoor, outdoor, or mixed, and vulnerability factors can be added. Graphical display of LSIR and IRPA can be added via Risk Contours / Isosurfaces.
- Navisworks files (.nwd, .nwc) can now be imported directly. The file importer is included alongside many improvements to geometry import and triangle reduction, in terms of speed and memory overhead.
- Additional security measures have been added to combat piracy. These include an invisible mark that records which installation produced the image and when, which can be verified on the web portal. The watermarks enable third-parties to verify whether output in reports and presentations has been generated using a licensed version of the software.
Feature Improvements
Quantitative Risk Assessment (QRA)
-
QRA functionality and output have been added to the existing capability. Prior to Version 5.4, users had the ability to calculate fatality from toxic and thermal doses from probits. The QRA functionality is now extended by the ability to add Occupied Regions with defined personnel groups and occupancy, to give group / societal risk statistics, including F-N Curves. For visualization IRPA and LSIR risk contours and isosurfaces have been added.
-
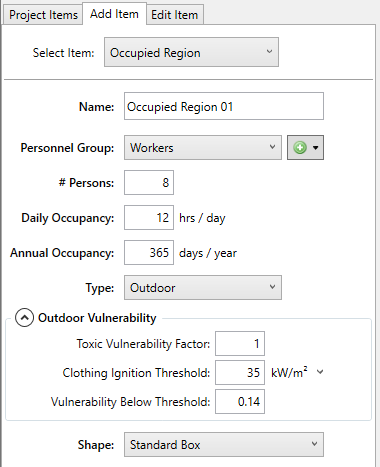
Occupied Regions can now be added from the Add Item tab as a standard box, an extruded polygon, or a point. Each region has a type (Building, Outdoor, or Mixed with a fraction indoors), a personnel group with daily and annual occupancy and a person count, a risk evaluation height, and indoor and outdoor vulnerability settings (clothing and building ignition thresholds, vulnerability below threshold, and toxic vulnerability factor). Personnel groups are managed with the new population group editor.
-
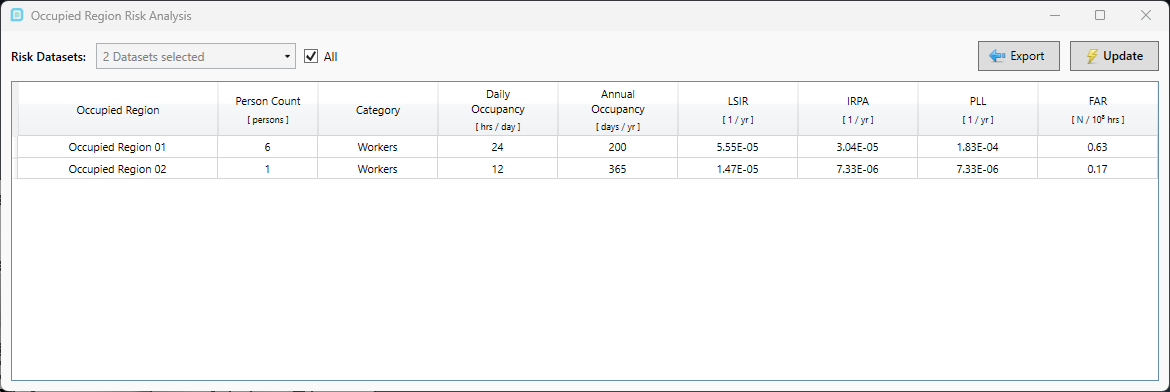
Added Occupied Region Risk Analysis (Project menu and toolbar). The window lists LSIR, IRPA, PLL, and FAR for each occupied region and each selected risk dataset together with the occupancy (hours per day, days per year, and person count), and exports the table.
-
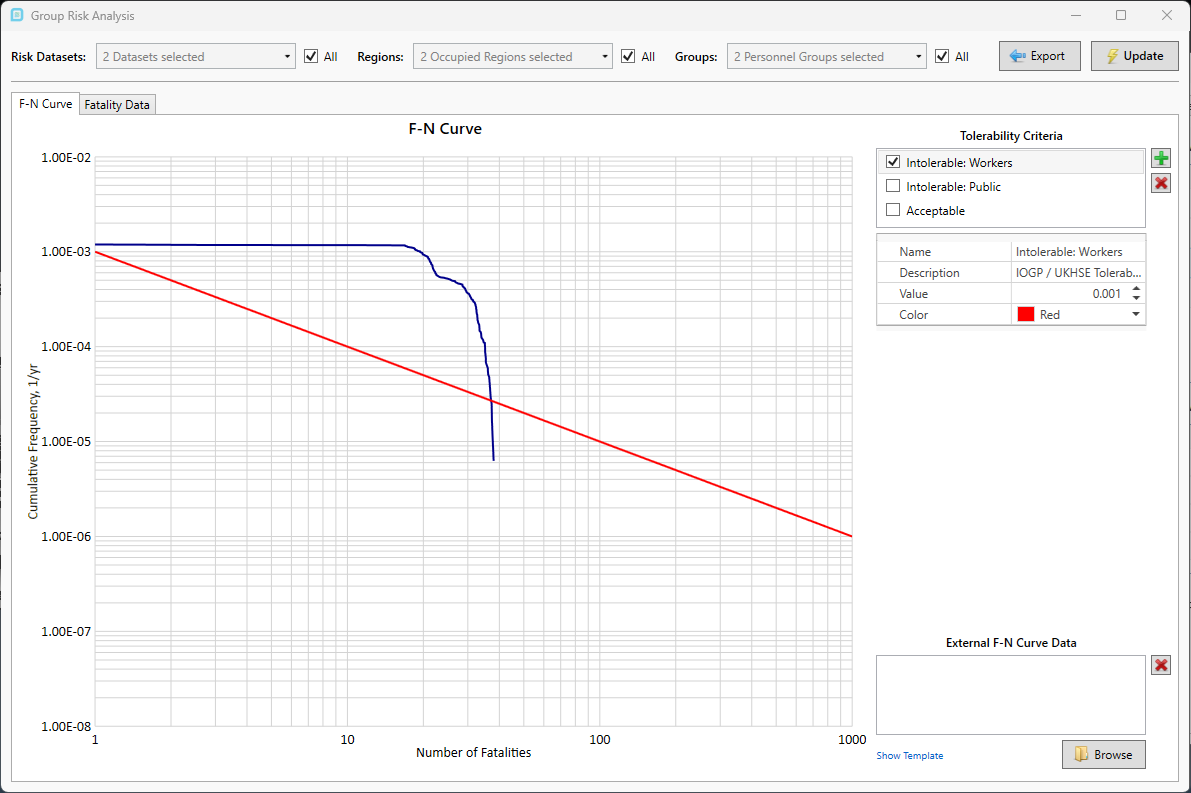
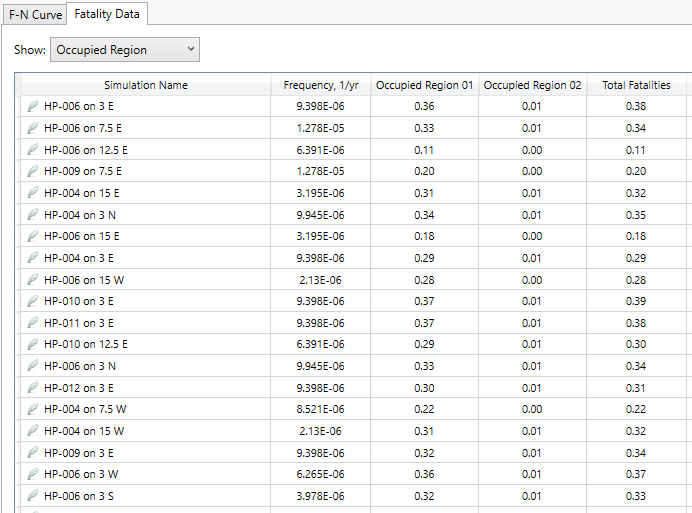
Added Group Risk Analysis (Project menu and toolbar). The window plots F-N curves (cumulative frequency against number of fatalities) per occupied region, per personnel group, per risk dataset, or as totals only. Tolerability criteria and external F-N curve data can be added to the chart, and the fatality data table and the chart can be exported to Excel, copied as a screenshot, or saved as an image.
-
Added User-Defined Probits (Risk Analysis tree > User-Defined Probits, or Add Item > User-Defined Probit). A thermal probit (dose = G4/3·dt) or a toxic probit for a selected fluid (dose = ppmn·dt) is defined by its k1 and k2 constants and becomes available as a fatality variable for risk datasets, maximum fatality risk contours and isosurfaces, LSIR, and IRPA.
-
The probit and the exposure time are now properties of the risk dataset, set in the property grid, instead of being entered in each risk contour or isosurface window. Changing either marks the dependent risk results as out of date. The Total LSIR and Total IRPA options are now available in the Add Risk Contour and Add Risk Isosurface windows.
Geometry Import & Navisworks Support
- Navisworks files (.nwd, .nwc) can now be imported directly. Hidden elements are skipped, and the colors are “by Entity”.
- Geometry simplification (triangle reduction) is several times faster, uses far less memory, and uses more processor cores on large models.
- The performance of the DWF importer has been greatly improved.
- All geometry importers require significantly less memory.
- Lines, polylines, circles, and arcs in DWF and NWD files, which were previously dropped, are now imported as display-only linework. The linework is drawn in the 3D view and saved with the project, but takes no part in meshing or obstruction.
Indoor Simulations
- Internal ventilation simulations now size the domain to the room automatically. The box drawn around the room is used to find the walls that enclose it, and the domain is tightened to those walls before the mesh is built, so the mesh and the solution no longer depend on how far outside the room the box was drawn. A new “Domain Adjustment” option when adding a ventilation simulation keeps the box as drawn (“Force User Domain”) instead of the default (“Shrink to Fit”), and the status display shows “Sizing…” while the domain is sized.
- Indoor meshes are finer and more consistent. The base mesh is now sized from the volume of the room rather than its aspect ratio, so rooms of every shape resolve the room height, and the mesh across each HVAC opening is refined further, so the flow through an opening no longer depends on where the grid lands on it. Outlets and openings that can only flow out keep a coarser mesh, which saves cells.
- HVAC inlets, outlets, and openings now deliver their specified flow more accurately. Forced inlets and outlets enforce their volume flow rate throughout the solve, including transient flow rates, and hold it as the mesh adapts. Passive openings set their pressure directly on the boundary, so the flow through an opening and the split between several openings follow the geometry, and the pressure correction is solved more tightly so that flow can no longer be pushed the wrong way through an opening.
- Because of these changes, an internal ventilation simulation re-solved in Version 5.4 gives a different result from Version 5.3: the mesh has roughly twice as many nodes, the solve takes longer, and the result is closer to the mesh-independent answer and no longer sensitive to the domain box. Dispersion and fire simulations that depend on a ventilation simulation should be re-solved with it if possible.
Security Features
- Exported images (Save Image as PNG, Copy to Clipboard, and batch image output) now carry an invisible origin mark that identifies the licensed installation and time of export. The image itself is never sent to Insight Numerics; the mark can be checked by dropping an image (PNG, JPG, GIF, or BMP) or a Word, PowerPoint, Excel, or PDF file that contains images onto verify.insightnumerics.com, where the check runs entirely in the browser and the file is never uploaded.
Performance
- Mesh adaption is about twice as fast, and the total solve time of a transient simulation is 25 to 30% shorter, on the desktop and on the cloud. The results are unchanged.
- Improved the stability of the pressure correction. When the capped pressure solve ended with a worse solution than it started from, the result was applied unchecked; it is now re-solved once with a larger budget, or skipped for that iteration.
Other
- Added a “Mesh Time” property to transient simulations (Mesh category of the property grid). The mesh can be shown as it was at any saved time step instead of only the final mesh, and the selection is saved with the project. Added a “Mesh Line Width” property for the mesh display.
- Saved transient time steps are now labeled with the fewest decimals that keep every time step distinct, for example “16.2 s” instead of “16.234722 s”, and times of a minute or more read as “1 h 5 min 3.5 s”. The new labels are used in the time step lists, the add-visual pickers, the legend, batch image and bulk output file names, monitor Excel workbook names, and progress messages.
- A dispersion or fire simulation whose ventilation simulation has no solved data now reports the reason (the ventilation simulation, the archive searched, and the cause) in its History card instead of failing with an unexplained error.
- Added File > Import from Excel > Porous Regions. Each row of the template (“porous regions.xlsx”, opened with Show Template) adds one box porous region with its name, type (Grated Deck or Porous Region), two corners, volume porosity, and area porosities. A row with an error is reported by its row number and skipped while the rest still import. The four Excel imports (Fluids, Inflows, Monitors, and Porous Regions) now sit together under File > Import from Excel, and the Monitor and Fluid import windows no longer widen with a long file path.
Bug Fixes
- Fixed issue where a project solved on the desktop and then solved again on the cloud, or re-solved from the saved file, could build a slightly different mesh. The solved boundary layer expansion ratio was written back into the saved mesh settings, so the next solve started from a different value. Meshes are now identical between the desktop, the cloud, and repeated solves of the same file.
- Fixed a memory leak where a completed simulation kept its whole mesh in memory after it went to sleep or was archived, for the rest of the session.
- Fixed issue where a transient simulation saved or put to sleep during its first time step restarted with the wrong previous-step density, because the resume re-stored the current density as the start-of-step value.
- Fixed issue where a simulation re-submitted to a network solver service or to the cloud reported no progress for the whole solve, because the progress of the earlier run was carried in the solver file.
- Fixed error when post-processing a cloud simulation whose results had been uploaded but whose status was set to Error by a job timeout or a failure after the solve. The simulation is now accepted as complete when its result archive exists.
- Fixed the Volume Analysis window being too narrow for the transient time selector.
- Fixed issue where the pressure solve of an internal ventilation simulation could be cut off before it converged by the iteration limit of the previous pressure solvers, which on a cold start could produce velocities of hundreds of meters per second from 10 m/s inlets. The AMG solver now runs to convergence.
- Fixed a spurious eddy at the inlet of a room with only forced HVAC objects, caused by where the pressure correction was pinned. It is now pinned at the node furthest from any wall.
- Fixed the tangential wall fluxes being projected with the bent normal used by the wall functions instead of the true surface normal.
- Fixed crash “Index was out of range” when the risk analysis mesh was resized repeatedly. A node shared between two merging voxels could be stripped when only one of them merged, and the next mesh adaption then duplicated it.
- Fixed issue where adding a Porous Region with a porosity of 1 stored it in the project as 0.8 (and an area porosity of 1, 1, 1 as 0, 0, 0.8) while the text box kept showing the typed value. The typed values are now used as entered; only the 0 to 1 range is checked.
- Fixed error “Inflow Template not found” from Show Template with the Flow Rate option. The installer now includes the three Excel templates that were missing: the flow-rate leak template, the F-N curve data template, and the porous region template.
- Fixed issue where available cloud risk data was not shown in the UI.
Release Date:
October 14, 2026